他社比較

 MIXI
決算書 損益計算書(P/L)
MIXI
決算書 損益計算書(P/L)
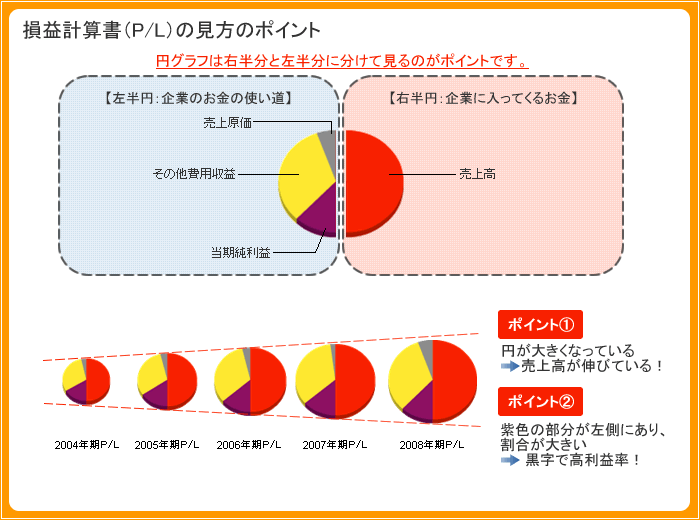
【左半円:企業のお金の使い道】 【右半円:企業に入ってくるお金】
円グラフにマウスをのせると項目を表示
| 決算年月日 | 2019年3月31日 | 2020年3月31日 | 2021年3月31日 | 2022年3月31日 | 2023年3月31日 |
|---|---|---|---|---|---|
| 売上高 | 144,032 | 112,171 |
119,319 |
118,099 |
146,867 |
| 売上合計 | 144,032 | 112,171 |
119,319 |
118,099 |
146,867 |
| 売上原価 | 20,224 | 21,292 |
26,009 |
31,710 |
41,746 |
| その他費用収益 | 97,287 | 80,118 |
77,618 |
76,127 |
99,959 |
| 費用等合計 | 117,511 | 101,410 |
103,627 |
107,837 |
141,705 |
| 売上総利益 | 123,808 | 90,879 |
93,310 |
86,389 |
105,121 |
| 税引前当期利益 | 39,063 | 15,978 |
23,201 |
16,035 |
11,254 |
| 当期純利益 | 26,521 (18.4%) |
10,761 (9.6%) |
15,692 (13.2%) |
10,262 (8.7%) |
5,162 (3.5%) |
| 当期純利益 | 26,521 | 10,761 |
15,692 |
10,262 |
5,162 |
※単位:百万円
ディー・エヌ・エー
決算書 損益計算書(P/L)
【左半円:企業のお金の使い道】 【右半円:企業に入ってくるお金】
円グラフにマウスをのせると項目を表示
| 決算年月日 | 2019年3月31日 | 2020年3月31日 | 2021年3月31日 | 2022年3月31日 | 2023年3月31日 |
|---|---|---|---|---|---|
| 売上高 | 124,116 | 121,387 |
136,971 |
130,868 |
134,914 |
| 売上合計 | 124,116 | 121,387 |
136,971 |
130,868 |
134,914 |
| 売上原価 | 56,206 | 58,603 |
62,040 |
64,931 |
70,825 |
| その他費用収益 | 55,200 | 111,949 |
49,301 |
35,405 |
55,231 |
| 費用等合計 | 111,406 | 170,552 |
111,341 |
100,336 |
126,056 |
| 売上総利益 | 67,910 | 62,784 |
74,931 |
65,937 |
64,089 |
| 税引前当期利益 | 18,069 | -40,235 |
31,259 |
29,419 |
13,595 |
| 当期純利益 | 12,710 (10.2%) |
-49,165 (-40.5%) |
25,630 (18.7%) |
30,532 (23.3%) |
8,858 (6.6%) |
| 当期純利益 | 12,710 | -49,165 |
25,630 |
30,532 |
8,858 |
※単位:百万円
グリー
決算書 損益計算書(P/L)
【左半円:企業のお金の使い道】 【右半円:企業に入ってくるお金】
円グラフにマウスをのせると項目を表示
| 決算年月日 | 2019年6月30日 | 2020年6月30日 | 2021年6月30日 | 2022年6月30日 | 2023年6月30日 |
|---|---|---|---|---|---|
| 売上高 | 70,936 | 62,665 |
56,766 |
74,906 |
75,440 |
| 売上合計 | 70,936 | 62,665 |
56,766 |
74,906 |
75,440 |
| 売上原価 | 31,400 | 28,602 |
25,632 |
30,054 |
28,831 |
| その他費用収益 | 36,050 | 31,353 |
17,601 |
34,730 |
37,332 |
| 費用等合計 | 67,450 | 59,955 |
43,233 |
64,784 |
66,163 |
| 売上総利益 | 39,536 | 34,063 |
31,134 |
44,852 |
46,609 |
| 税引前当期利益 | 5,531 | 6,031 |
13,398 |
14,598 |
12,693 |
| 当期純利益 | 3,486 (4.9%) |
2,710 (4.3%) |
13,533 (23.8%) |
10,122 (13.5%) |
9,277 (12.3%) |
| 当期純利益 | 3,486 | 2,710 |
13,533 |
10,122 |
9,277 |
※単位:百万円
PR
- 検索
- 業種別業績ランキング